Traditional Workflow

▶
▶
▶
▶

▶
▶
Platelet Workflow
▶
▶
Combining separate workflows into one
No reshaping, no reannotation, no loss of context.
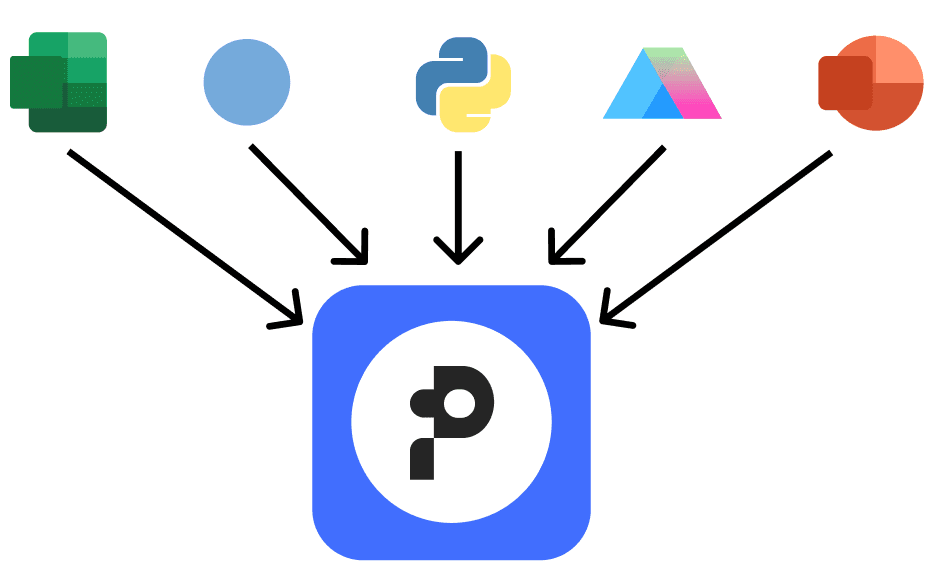

Design experiments, analyze data and visualize with tools built for your assay.
Bench science still runs on a patchwork of Excel sheets, one-off scripts, and manual copy-paste between tools. Platelet replaces that with a single structured platform.
Go from plate to analysis to publication-ready figure without the handoffs, reformatting, and lost context in between.
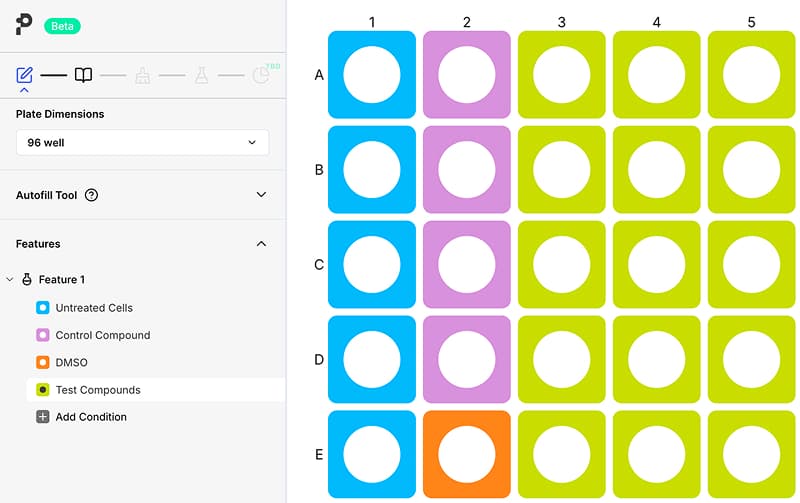
| Well | Condition | Conc. |
|---|---|---|
| A1 | Vehicle | — |
| A2 | Compound X | 1 μM |
| A3 | Compound X | 10 μM |
| ... | 96 wells mapped | |
Design structured experiments, apply robust normalization and anomaly detection, and generate publication-ready insights — all within a single, reproducible workflow.
Point Platelet at your raw export and pick the assay type — the pipeline, statistics, and output are already configured.
Turn a raw Ct export into fold-change, without touching a formula.
Ct values per well, tagged with reference gene, target gene, and group.
ΔΔCt, fold-change, propagated error, group comparisons.
Fold-change chart with statistics, ready for a figure.
Join researchers worldwide who are streamlining their workflows with Platelet. Start designing experiments, visualizing data, and generating insights today.